Tumbuktu
Junior Member
- Joined
- May 23, 2013
- Professional Status
- Certified Residential Appraiser
- State
- Texas
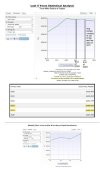
I submitted the following chart (Median Close Price VS Primary Year) for 'Market Condition Analysis'
There is a conflict, Chart shows 'Market is Declining' whereas appraiser has marked it Stable
I have following questions

- Three Miles Radius was chosen to get enough statistical sample (3365 properties)
- Stats of Year 2025 only consist of Jan to Mar & few days of April (based on 116 properties)
- I find this chart inconclusive
- I based my analysis mainly on Year 2024
- Price decreased from $485,000 to $480,000
- $5000 decrease is around 1%
- This is too small a decrease so I considered it Stable
There is a conflict, Chart shows 'Market is Declining' whereas appraiser has marked it Stable
I have following questions
- If such a stringent standard is applied, then no market can ever be marked as stable (even $1 difference in either direction would put it increasing or declining). In the current case, if at the end of 2024 the price was $486,000 then the market is increasing and $484,000 would put it declining
- How much data is considered reliable.
- In the current case 3 miles radius yielded 3365 properties [3249 properties for 4 years (Jan 2020-Dec 2024)] if we exclude the few months of Year 2025


