- Joined
- Jun 27, 2017
- Professional Status
- Certified General Appraiser
- State
- California
Software & Documentation & Room Photos (inder images folder)
GitHub: https://github.com/wcraytor/KgNN01
https://github.com/wcraytor/KgNN01/blob/main/notebooks/room_type_identification.ipynb
Kaggle: (Almost completed, this will give you 30 hours/week, free, of running the code in Kaggle)
I just finished a Python and Jupyter program for classifying rooms by one of 10 room types: bathroom, dining, gaming, kitchen, laundry, living, office, terrace, and yard. It operates on a dataset of approximately 12,000, 512x512 pixel room photos. You can select the percentage of photos you want it to use, in case you don't have a fast computer. However, this typically lowers the accuracy of classification.
1. If all photos are used for training (70%), validation (15%), and testing (15%), I can get about 98% accuracy on the training data and 88% accuracy on the test data. This is not perfect, of course, but then if an appraiser were to go through these 12,000 photos, he probably couldn't do much better. Just imagine the photo of a living room with a dining room table in it: Is it really a living room or a dining room? Or how about gaming vs office when both typically have TVs and computers? So, some inaccuracy is to be expected, because that is the nature of things.
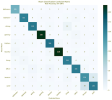
2. Here is the "Confusion Matrix" produced by just using 25% of the data - and it gets about 87% accuracy on the validation data. That is not bad. Actually, at 100% of the data, the accuracy only went up to 89%. What you see in the colored cells on the diagonal is the number of correct classifications. The others indicate the number of times the given room was incorrectly classified for another. As you might expect, the most confusion occrurs with living vs dining rooms, With the 100% sampling, you get a more realistic picture of confusiong: gameing rooms vs offices and so on. Quite frankly this will be good enought for valuation purposes.

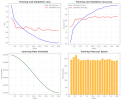
Here are the results for running with 20 "epochs" (i.e. repeated runs, where the model matrix is consistently modified with partial deriivatives, aka the hill-climging approach.

Next Stage: I will modify the program to create models that use an array of photos for each property to predict the house price residuals - to be used in predicting the residual for the Subject Property. IF that works sufficiently good, then that CLOSES THE LOOP for fully objective and automated appraisal. Bad News vs Good News depending on your perspective.
GitHub: https://github.com/wcraytor/KgNN01
https://github.com/wcraytor/KgNN01/blob/main/notebooks/room_type_identification.ipynb
Kaggle: (Almost completed, this will give you 30 hours/week, free, of running the code in Kaggle)
I just finished a Python and Jupyter program for classifying rooms by one of 10 room types: bathroom, dining, gaming, kitchen, laundry, living, office, terrace, and yard. It operates on a dataset of approximately 12,000, 512x512 pixel room photos. You can select the percentage of photos you want it to use, in case you don't have a fast computer. However, this typically lowers the accuracy of classification.
1. If all photos are used for training (70%), validation (15%), and testing (15%), I can get about 98% accuracy on the training data and 88% accuracy on the test data. This is not perfect, of course, but then if an appraiser were to go through these 12,000 photos, he probably couldn't do much better. Just imagine the photo of a living room with a dining room table in it: Is it really a living room or a dining room? Or how about gaming vs office when both typically have TVs and computers? So, some inaccuracy is to be expected, because that is the nature of things.
2. Here is the "Confusion Matrix" produced by just using 25% of the data - and it gets about 87% accuracy on the validation data. That is not bad. Actually, at 100% of the data, the accuracy only went up to 89%. What you see in the colored cells on the diagonal is the number of correct classifications. The others indicate the number of times the given room was incorrectly classified for another. As you might expect, the most confusion occrurs with living vs dining rooms, With the 100% sampling, you get a more realistic picture of confusiong: gameing rooms vs offices and so on. Quite frankly this will be good enought for valuation purposes.

Here are the results for running with 20 "epochs" (i.e. repeated runs, where the model matrix is consistently modified with partial deriivatives, aka the hill-climging approach.

Next Stage: I will modify the program to create models that use an array of photos for each property to predict the house price residuals - to be used in predicting the residual for the Subject Property. IF that works sufficiently good, then that CLOSES THE LOOP for fully objective and automated appraisal. Bad News vs Good News depending on your perspective.
