• Welcome to AppraisersForum.com, the premier online  community for the discussion of real estate appraisal. Register a free account to be able to post and unlock additional forums and features.

How Long Do You Think It Will Be?

Status
Not open for further replies.
:rof: You are hilarious! :rof:

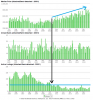
Let me ask you. Were you tracking the number of active listings pre-financial crisis?

NO. Because you were not able to collect that data. If you were able to you would have seen it building sharply from 2004-2006.

You are factually incorrect. We were tracking everything in real time for YEARS prior to the tipping point in mid-2005 when it first started our our region.

See, you don't know any of the facts you're attempting to lecture us on because you were still waiting tables back when we were doing this in real time. You're trying to backfill your understanding of events after the fact.

And no, the listing activity DID NOT ramp up over a long period of time in this region. It didn't start ramping up until the market peaked and the number of buyers declined. Think about this - on the way up the standing inventory will be a lagging indicator, not a leading indicator. It's when the pricing is in decline that the absorption of standing inventory will indicate to a looming reversal in pricing.

The metering of standing inventory by the noteholders has been of effect on pricing. if they had been forced to comply with mark-to-market accounting rule the last bust would have been a lot more pronounced in effect.
 
Last edited:
upload_2018-5-24_19-35-47.png

Just look at the level active listings were in 2006/2007 and look where it is now. As soon as active listings dropped below 50 in this zip price has been going up. This is called SHORTAGE.
 

Attachments

  • upload_2018-5-24_19-31-41.png
    upload_2018-5-24_19-31-41.png
    235.4 KB · Views: 1
You are factually incorrect. We were tracking everything for YEARS prior to the tipping point in mid-2005 when it first started our our region.

See, you don't know any of the facts you're attempting to lecture us on because you were still waiting tables back when we were doing this in real time.

Okay. Let me see some of your active listing analysis or data from back in the day then. Show me.
 
edit wrong thread
 
Last edited:
The one thing you have figured out is "in this zip". Randolph and I were working in SD County, which was one of the canary markets for the nation. This market both entered and exited the bust before anywhere else. If you look at your graph it's plain to see that the market you're analyzing went from 90 to 160 in a 5-month period in late 2006. Our local cycle started a year prior to that. The LA market entered decline after your's did.
 
Last edited:

Speak for yourself, homeboi. I personally designed and distributed to thousands of appraisers a free 1004MC tool that counted EVERY listing during the requisite time frames. For free. Even though I wasn't even using it in my work. Randolph helped me to debug it.

We were online with that tool before the form even became mandatory. For all I know, what you're using now may even be based on my original tool because some of the MLS systems adopted my tool directly into their systems.

Actually, I take that back. If your vendor was using anything based on my tool you'd have access to how many listings were active during those prior periods. I had that working from Day 1.
 
Last edited:
Speak for yourself, homeboi. I personally designed and distributed to thousands of appraisers a free 1004MC tool that counted EVERY listing during the requisite time frames. For free. Even though I wasn't even using it in my work. Randolph helped me to debug it.

We were online with that tool before the form even became mandatory. For all I know, what you're using now may even be based on my original tool because some of the MLS systems adopted my tool directly into their systems.

Datamaster does that too. The point is show me that active listings did not increase for at least 2 years to those 2016 levels before prices declined. Look where active listings are now.
Actually since you have your free tool why don't you put together a chart of active listings in your market for the last 20 years and show me.
 
I am showing hard data to make my case and you are talking about been there and done that.
 
Okay. Let me see some of your active listing analysis or data from back in the day then. Show me.
The MC analysis is designed to measure a specific market segment. I only included provision for analyzing up to 500 records at a time so it's not suitable for analyzing the 39,000 sales we racked up in 2005. That's not a cop-out
 
Status
Not open for further replies.
Find a Real Estate Appraiser - Enter Zip Code

Copyright © 2000-, AppraisersForum.com, All Rights Reserved
AppraisersForum.com is proudly hosted by the folks at
AppraiserSites.com
Back
Top