• Welcome to AppraisersForum.com, the premier online  community for the discussion of real estate appraisal. Register a free account to be able to post and unlock additional forums and features.

New market analysis changes.

I believe that appraisers will likely copy and paste a random chart into their reports just to meet the requirements. Fannie will accept this because having something is better than nothing, allowing their AMC partners to continue achieving their substantial profit margins.
 
I believe that appraisers will likely copy and paste a random chart into their reports just to meet the requirements. Fannie will accept this because having something is better than nothing, allowing their AMC partners to continue achieving their substantial profit margins.
There is no requirement for a graph
 
There is no requirement for a graph
There is, however, requirement for illustration of the methodology used. This could be in the form of a graph... or you could provide your regression line.

From the Freddie Guide:
  • Include an illustration of the methodology used to determine specific comparable sale time adjustments for changes in market conditions
Interesting, I don't do any work for Freddie, but Fannie has no such requirement. "Fannie Provided an illustration for how to think about market condition (e.g., time) adjustments and how it relates to a value trend. Failure to make time adjustments when they are indicated by market data is an unacceptable appraisal practice. Note: Appraisers are not required to include the illustration in their appraisal reports; we added a link in the Selling Guide to the illustration only as a learning aid"
 
Interesting, I don't do any work for Freddie, but Fannie has no such requirement. "Fannie Provided an illustration for how to think about market condition (e.g., time) adjustments and how it relates to a value trend. Failure to make time adjustments when they are indicated by market data is an unacceptable appraisal practice. Note: Appraisers are not required to include the illustration in their appraisal reports; we added a link in the Selling Guide to the illustration only as a learning aid"
The part about Fannie requirements is correct. I'm curious how you know you don't do any work for Freddie, as most direct sellers have not locked Fannie OR Freddie when the appraisal is ordered...
 
There is, however, requirement for illustration of the methodology used. This could be in the form of a graph... or you could provide your regression line.

From the Freddie Guide:
  • Include an illustration of the methodology used to determine specific comparable sale time adjustments for changes in market conditions
Where is that from? The FNMA Selling Guide says: "The appraisal report must, at a minimum, summarize the supporting evidence and include a description of the data sources, tool(s), and technique(s) used." The Freddie Mac Seller/Servicer Guide says: "The appraisal report must contain the market analysis that supports the indicated market trends and any adjustments made for market conditions." Both have refuted the claims that an illustration must be included in reports.
 
An adjustment of 0 requires no less support/documentation than an adjustment of X%,
Sufficient data can lead to either a zero or non-zero adjustment. Insufficient data pretty much always leads to a zero conclusion. Therefore, an adjustment of zero can require less support than an adjustment of $X. Fannie recognizes this.

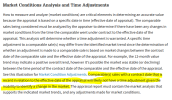
1738708357690.png
 
So why are they saying we have to have this detailed market analysis and use an adjustment for the month the comparable was sold? Is that overkill or do we have to do it that way now? I use Titan Analytics and a custom spreadsheet for my closed sales analysis. However, those don't break down what the increase/decrease is for each month.
I do not see where they say that.
 
They want us to discuss/indicate the overall trends, as well as the trends for the comps, and make sure we are applying time adjustments where warranted. They specifically say they don't need charts, etc. Where their literature seems to contradict itself is the guidance on the neighborhood section price trends on Page 1. Is it high-low-predominant sales in all price ranges in the market area, or only properties that would qualify as comps? Never seem to get a straight answer on that one. On page 2 top of the sales grid is where you put the price ranges of the comps. So I always indicate the overall market area trends on page 1 because that makes more sense so you can get a sense of where the subject stands in the overall market.
 
Last edited:
Find a Real Estate Appraiser - Enter Zip Code

Copyright © 2000-, AppraisersForum.com, All Rights Reserved
AppraisersForum.com is proudly hosted by the folks at
AppraiserSites.com
Back
Top