• Welcome to AppraisersForum.com, the premier online  community for the discussion of real estate appraisal. Register a free account to be able to post and unlock additional forums and features.

Overall Market Trend (Min 12 months)

Value Ninja

Sophomore Member
Joined
Nov 25, 2003
Professional Status
Certified Residential Appraiser
State
Alabama
The new Selling Guide update requires that we "Establish a minimum timeframe of 12 months from which the overall market trend must be derived". Does OVERALL MARKET TREND in this context refer to the box on the Neighborhood section of the URAR? This is question #1

I work in a coastal, seasonal market which very predictably (when the world is normal at least), increases in the Spring and Summer and decreases from late Fall through early Winter. Values and total# of sales are very highly correlated. There are few transitional months where values are actually stable, but most of the time they are either increasing or decreasing and I make adjustments reflecting this reality. However, a linear trend line on a 12 month chart may be flat (stable). So Question #2. In my market, let's say I am 4 months into a increasing or decreasing seasonal cycle, but the 12 month trend is stable, Does FNMA want me to check to STABLE box (based on question 1 above or the established direction the market has actually been moving in for months?

I should say that over my 20+ years, I have waffled a bit with this.. At some points in my career I have described it as stable but with seasonal effects and checked the STABLE box referincing a stable 12 months linear trend line. At other times, I have described it narratively exactly the same way but have checked whatever box was appropriate for the medium term established trend.

Also, while FNMA's example chart shows a lack of real world/practical understanding of both the messiness of real estate data and statistics in general, it does at least draw attention to the fact that markets can move in a non-linear direction, and adjustments should reflect the market. Maybe that will help with lack of understanding from reviewers on this specific issue.
if I saw seasonal fluctdioains, I might reconcile to teh higher side of value in peak season and reconcile on the lower rang of value in the slow season and explain why, and not make an adjustment.

Wrt IMO the market trend they want to see support for is the market trend for the subject market area - the type , size, location etc of houses that compete with the subject and that you mighs consider as a comp, and the market area may or may not be confined to the neighborhood.

A geo area neighborhood might contain a wide variety of houses, some of which are not similar to the subject .


A trade-off we always have. Restricting your market trend analysis to comparable properties in your market area often means not having a sufficient number of data points to derive a reliable market trend in the first place. Broaden out to the point of enough data risks calculating a trend that does not match your specific market segment. I think it's best to assess this on a case-by-case basis depending on the quality/quantity of your data. But FNMA discusses possible data sources for the market trend as Home Price Indexes, so it appears they are thinking bigger not smaller in terms of data. I find broader data (zoomed out just to the minimum extent necessary to bring in enough data) tends to work better except for specific specialized/niche segments which do not track the broader market at all.
 
A trade-off we always have. Restricting your market trend analysis to comparable properties in your market area often means not having a sufficient number of data points to derive a reliable market trend in the first place. Broaden out to the point of enough data risks calculating a trend that does not match your specific market segment. I think it's best to assess this on a case-by-case basis depending on the quality/quantity of your data. But FNMA discusses possible data sources for the market trend as Home Price Indexes, so it appears they are thinking bigger not smaller in terms of data. I find broader data (zoomed out just to the minimum extent necessary to bring in enough data) tends to work better except for specific specialized/niche segments which do not track the broader market at all.
Imo, broad county-wide or similar large data-driven is not very meaningful- - though if you want to run, it, do so - I mo more relevant to teh assignment is a search similar to that we use to find copms but we can broaden it a bit to get enough data - and if we want to include a second wider search we can and explain any difference, which it seems the GSE;s want as well.

I am running an MC from seems they still want it and a somewhat broader than normal comps search - 15 -20 sales is plenty, IMO even 10 is enough to see a trend, can add listings and spending to fill it out more
True when you have 10 good sale comps, the trend can be observed. No need to have tens and tens of data points.
 
The new Selling Guide update requires that we "Establish a minimum timeframe of 12 months from which the overall market trend must be derived". Does OVERALL MARKET TREND in this context refer to the box on the Neighborhood section of the URAR? This is question #1

I work in a coastal, seasonal market which very predictably (when the world is normal at least), increases in the Spring and Summer and decreases from late Fall through early Winter. Values and total# of sales are very highly correlated. There are few transitional months where values are actually stable, but most of the time they are either increasing or decreasing and I make adjustments reflecting this reality. However, a linear trend line on a 12 month chart may be flat (stable). So Question #2. In my market, let's say I am 4 months into a increasing or decreasing seasonal cycle, but the 12 month trend is stable, Does FNMA want me to check to STABLE box (based on question 1 above or the established direction the market has actually been moving in for months?

I should say that over my 20+ years, I have waffled a bit with this.. At some points in my career I have described it as stable but with seasonal effects and checked the STABLE box referincing a stable 12 months linear trend line. At other times, I have described it narratively exactly the same way but have checked whatever box was appropriate for the medium term established trend.

Also, while FNMA's example chart shows a lack of real world/practical understanding of both the messiness of real estate data and statistics in general, it does at least draw attention to the fact that markets can move in a non-linear direction, and adjustments should reflect the market. Maybe that will help with lack of understanding from reviewers on this specific issue.
Just addressed in another thread:

 
The 1004MC forced appraisers to use a 12 month trend.
Before I could just look at more recent months and make a decision.
I still could but soon have to comment more on 12 month history.
 
Imo, broad county-wide or similar large data-driven is not very meaningful- - though if you want to run, it, do so - I mo more relevant to teh assignment is a search similar to that we use to find copms but we can broaden it a bit to get enough data - and if we want to include a second wider search we can and explain any difference, which it seems the GSE;s want as well.

I am running an MC from seems they still want it and a somewhat broader than normal comps search - 15 -20 sales is plenty, IMO even 10 is enough to see a trend, can add listings and spending to fill it out more
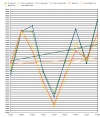
I posted this one in another thread. Rural property I am seeing tomorrow. It is a macro since I only had 4 similar sales in the past year. Did it quarterly since I only had 72 sales in the past 12 months and 61 sales in the previous 12 months in a 100+ sq mile neighborhood. All of the low points were periods of very low sales volume. Figure this one out. 1 of my sales is in March, 2 in June and 1 in late November

1738200079450.png
 
What purpose of Fannie to force appraisers to do market/time adjustments. Time adjustments are difficult because of many factors - seasonality, nonlinear trend, lack of data let alone good comps, etc.
Appraisers are set to higher bar & knowledge and to do more work to decide if market conditions are warranted.
If data and market unclear, it's best not to do time adjustments or at least make conservative adjustments.
Sounds like lenders have influenced Fannie to force appraisers to be appraise higher using time adjustments.
 
Find a Real Estate Appraiser - Enter Zip Code

Copyright © 2000-, AppraisersForum.com, All Rights Reserved
AppraisersForum.com is proudly hosted by the folks at
AppraiserSites.com
Back
Top