Presuming you are selecting somewhat similar data to match the subject...
if my subject is 2,000sf, I'm looking at homes 1,750 to 2,500sf, similar lot sizes (maybe a range from 6k to15k sf) and overall similar age,
...chances are fairly good that when I regress for GLA, I'm going to have a reasonable starting point (the incremental contributory value for each additional square-foot of living area within that data set). This can be refined using sensitivity analysis.
I use regression in my reports, but for residential work, I don't consider it the final say-so. It provides an indication to which I then refine to my selected unit of adjustment.
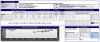
Trend analysis is sometimes better: Comparing two sides of the street with the same kind of homes on each side over the last 3-years using date and sale price. Homes on the west side of the street back to other homes. Homes on the east side of the street back to the Hopland High School. Trend the west side of the street and then trend the east side of the street (both trend lines on the same chart); if you see a gap between the trend lines, that is strong evidence that an adjustment is warranted. You can use that gap to approximate the adjustment, and then refine it from there.
This problem can be solved in other ways, and one could use regression to do it as well (maybe using $/SF, and comparing the same square-footage using the two formulas; this will give you a higher and lower price indication; that difference is the basis of the adjustment). But a picture sometimes is worth a thousand words, and everyone can understand two lines on a chart, with the lines representing price differences, and the gap between the two representing the value difference for being on one-side of the street vs. the other.
Now, common sense tells us that all other things being equal, the homes backing to the school are going to be worth less than the homes that back to similar residential properties. The question is "how much?". The best answer may be, "this location can affect the price by 3-6%". And that's what I say:
"Based on the trend analysis, a location adjustment to reflect backing to the high school is reasonably within the 3-6% range. I've selected 5% and have applied that adjustment in the grid."
I've never had someone argue, "well, it should be 3 or it should be 6".
Depending on the element you are trying to analyze, that indication might suggest no adjustment up to some price-point.
"The analysis indicates a reasonable adjustment can be anywhere between zero to $25k. In my opinion, this feature is a positive market appeal item and would have an affect on value; I've therefore selected an adjustment of $15k, which is in the upper-half of the adjustment-range indication."
The analysis first (a) supports the decision to make (or not make) an adjustment and (b) if an adjustment is to be made, provides an indicated unit of adjustment to apply. The decision to adjust and how much to adjust should be based on some logical reasoning; it is the appraiser who provides that logical reasoning, and a sentence or two can communicate that logic to the client/intended user in the report.
You get the picture.