- Joined
- May 22, 2015
- Professional Status
- Certified Residential Appraiser
- State
- Pennsylvania
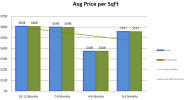
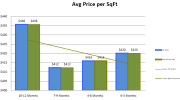
Time adjustment. Not sure what is being used, but i do a macro of the neighborhood sales, and then a micro of the sales range that i used. They can be somewhat similar in a vanilla neighborhood. But let's you say have new construction going on in a vanilla area, you might see a different time adjustment if that market is hotter. In a gentrifying, bad word, area that can be a difference from normal c4 sales. I usually find either the macro or the micro chart to look pretty in my report.
My understanding that with the new 1004 that they would like more visual aids like chart and graphs. Makes sense, show that you did a little more thought than the average dope. My degree is in education. I took visual aids. Most report writers don't understand, or seem to care, that certain things say a lot without being wordy. People always look at visual aid instead of reading a paragraph.
And remember with the amount of data, it can be skewed, but still informative.
Below is the neighborhood graph, then the subject's competing properties graph.


