• Welcome to AppraisersForum.com, the premier online  community for the discussion of real estate appraisal. Register a free account to be able to post and unlock additional forums and features.

This is a pretty niffty detailed chart for finding time adjustments, we are done.

Tom D

Elite Member
Gold Supporting Member
Joined
May 22, 2015
Professional Status
Certified Residential Appraiser
State
Pennsylvania
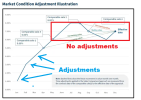
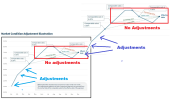
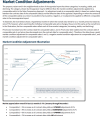
Beginning in February 2025, appraisers will be required to provide support for time value adjustments for comparable sales (comps) and market conditions—and also include an illustration of the methodology used.

If we can have a program that says and does this and puts in the numbers, life gets easier. If you have to figure out yourself all this and write it, no extra pay for extra time spent. Also, this is showing you that fannie has the program to burn you. And of course, their avm will have this. Another domino falls to end of appraisers.
1733920484780.png
 
  • Haha
Reactions: DTB
Beginning in February 2025, appraisers will be required to provide support for time value adjustments for comparable sales (comps) and market conditions—and also include an illustration of the methodology used.

If we can have a program that says and does this and puts in the numbers, life gets easier. If you have to figure out yourself all this and write it, no extra pay for extra time spent. Also, this is showing you that fannie has the program to burn you. And of course, their avm will have this. Another domino falls to end of appraisers.

View attachment 94533
Crazy. The market does not work like that, and how in the world did they chart it anyway? MV is the VALUE, not a stand-alone price affected hourly or by the minute, like the stock trading.

The additional content in the article explains why they are drilling down on time adjustments and that (according to them ) too a small percent of appraisals have them. ( why would you adjust in a stable market-) - it goes on to explain how not making enough time adjustments leads to underappraisal in minority market areas.

What the heck is appraising, and why are they also not concerned with appraising, which seems far more prevalent? Under apprising compared to what? What benchmark is for there for that?
I am no Trump fan, but his voters ( or appraisers in general) might want to bring it to the attention of the new admin wrt this in reining in the worst of DEI policy - the entities seem like they are trying to bend appraisals into higher values in minority areas - MV is MV -if they want a different kind of value then come out and declare it. The reference is about how they are going to look for adjusting or similar verbiage for age or location!! The market recognizes different ages when it affects value, and location is a critical component of value.

Properties are not automobiles that can be valued by set charts and numbers like a blueprint for automobiles, but they are trying to make it that way. RE is long life, not like a car, and it has many influences-some of which can not be standardized.. REis anchored to location, a fixed location and its influence is a key component of RE.
 
Beginning in February 2025, appraisers will be required to provide support for time value adjustments for comparable sales (comps) and market conditions—and also include an illustration of the methodology used.
There is no requirement for an illustration. The requirement is to include support for the reported market conditions and market condition (time) adjustments (or lack thereof). Using an illustration is one possible way to show support.

The illustration in the announcement was based, in part, on what some include in actual appraisal reports today. Of course, the level of analysis one can do depends on the available data in the market area.
 
An illustration is a decoration, interpretation, or visual explanation of a text, concept, or process, designed for integration in print and digitally published media.

I took visual aids in college for my education degree. That chart above, if easily doable, is certainly easier to understand than 6 pages of blah, blah, blah support wording. I can't argue with those adjustments seeing that chart. I don't get to see CU and all it's layers. Does CU come out with a % that you should have used, but nothing was used. My case is that another appraisal line can now be done by the avm, as good or better than you can human. My understanding is that fannie wants to see more charts or graphs, and the new uad will have expandable areas where needed to put them.
I don't know why they are now advocating for such overly sensitive monthly time adjustments which seemed geared toward reaching a price rather than a value.
 
The main thing to take away from the illustration is that the adjustment for the date of sale doesn't have to be x% per month.
 
1733928144753.png

If you continue to see the same market conditions, then you would expect to see the overall trend continue in the spring.
 
The requirement is to include support for the reported market conditions and market condition (time) adjustments (or lack thereof). Using an illustration is one possible way to show support.
So, when / what would be the threshold for a market conditions adjustment in a rural area with only 4 comparable properties in half a county? I mean there is some number where statistically there is no justification for an adjustment but from simple assessment there is the two alternatives of either saying the market is declining or the market is increasing because two sales are below the trendline and two are above. Inquiring minds want to know.

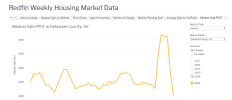
Further, since these sales in an area where overlapping MLS's compete and I don't have ready access to one MLS (Tulsa), and the NEO MLS and NWA MLS pretty much split 90% of the sales, then which greater database do I use? The Tulsa stats seem flat, NWA is still growing 5% and NEO maybe half that. So, what if I rely upon the Redfin data for that county? Would I be amiss? Would secondary market proffer a different opinion using a different method? Would they have their own internal numbers and use a different (wider, lesser) selection of data points?

So, do I use this laughable indicator of change? Me no tink so. Jeez, I am glad I don't do secondary market.
1733928404871.png
 
Find a Real Estate Appraiser - Enter Zip Code

Copyright © 2000-, AppraisersForum.com, All Rights Reserved
AppraisersForum.com is proudly hosted by the folks at
AppraiserSites.com
Back
Top