• Welcome to AppraisersForum.com, the premier online  community for the discussion of real estate appraisal. Register a free account to be able to post and unlock additional forums and features.

This is a pretty niffty detailed chart for finding time adjustments, we are done.

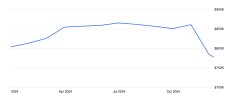
While I prefer using one, two, or three month old sales, that don't require adjustment. I don't know if Redfin or Zillow factor the recent rise in interest rates to influence value. But, looking at a Zestimate history for a neighborhood essentially provides what's going on for 'average' sales price and could be used to support time adjustments. The trouble is Zestimates, like the GSEs, don't know the actual neighborhood of your subject property.

price trend.jpg
 
The linear pattern indicates a market trend
Maybe, maybe not. Most often the data is forced into a linear pattern because the appraiser(s) are too lazy to be more precise (myself included).
 
I'm not sure why everyone is getting worked up over this issue. The bar is now so low that anyone can clear it with room to spare. From the FNMA Selling Guide issued today, the actual requirements are:

"Time adjustments, or the lack thereof, must be supported by evidence. Use of home price indices (HPIs) to support time adjustments is consistent with our policy. The adjustment rates can also be determined through statistical analysis, modeling, paired sales, or other commonly accepted methods. The appraisal report must, at a minimum, summarize the supporting evidence and include a description of the data sources, tool(s), and technique(s) used."

The FHFA HPI calculator appears to cover the entire USA, so just put in State, MSA, quarter of sale, quarter of valuation, sale price, and Enter. An answer will appear on our screen.


Don't read the fine print:
"When using the FHFA House Price Calculator, please note that it does not project the actual value of any particular house. Rather, it projects what a given house purchased at a point in time would be worth today if it appreciated at the average appreciation rate of all homes in the area. The actual value of any house will depend on the local real estate market, house condition and age, home improvements made and needed, and many other factors. Consult a qualified real estate appraiser in your area to obtain a professional estimate of the current value of your home. Title XI of the Financial Institutions Reform, Recovery, and Enforcement Act of 1989 requires that any appraisal used in connection with a federally related transaction must be performed by a competent individual whose professional conduct is subject to supervision and regulation. Appraisers must be licensed or certified according to state law.

The FHFA House Price Calculator uses the FHFA Purchase-Only House Price Index (not seasonally adjusted) for all states, including the District of Columbia, and for the largest 100 Metropolitan Statistical Areas and Divisions. For all other Metropolitan Statistical Areas and Divisions the FHFA All-Transactions Index is used. For a list of the largest 100 Metropolitan Statistical Areas and Divisions, click here. For a discussion of the differences between the Purchase-Only Index and the All-Transactions Index, click here."
Seems like a great tool to pretend that you did something relevant. In my state the areas are very general and there is not enough inputs to be useful. WIthin those areas you could have property prices moving in different directions and vastly different rates.

Looking at it a house that sold for $50,000 and $10,000,000 had the same rate of change over a year. I find that very unlikely.
In the Spring Catalog, er, Selling Guide, we will get a chart of adjustments that will meet policy (makes me think I need to build an outhouse). Then everyone can be consistent with policy. No one will be appraising, but in government, if it is on paper, it is golden!
 
Beginning in February 2025, appraisers will be required to provide support for time value adjustments for comparable sales (comps) and market conditions—and also include an illustration of the methodology used.

If we can have a program that says and does this and puts in the numbers, life gets easier. If you have to figure out yourself all this and write it, no extra pay for extra time spent. Also, this is showing you that fannie has the program to burn you. And of course, their avm will have this. Another domino falls to end of appraisers.

View attachment 94533
How come Comp 1 is the oldest sale and Comp 4 the most recent on that graph?

I put my comparables in order of importance. The first 3 sales should cover all the components of brackening and or equality and similarity. And...be the most recent sales. That said, if chronologically, a dated sale of 18 months that would be slotted as number 6 on the grid was a model match in the immediate neighborhood.... that would be moved up to the number 3 slot. And, would most likely require a time adjustment.

It appears once again, that the ringleaders devising these graphs, charts and explanations..... are not actually going out there and doing it.

I do market adjustments the way Joe Flacco is explaining. But of course "it depends" on the data.
 
Maybe, maybe not. Most often the data is forced into a linear pattern because the appraiser(s) are too lazy to be more precise (myself included).
What does be more precise mean?

A market shows a trend in prices over a period of 2 months, 6 months a year etc that overall, is stable, increasing or decreasing.

At some points a stable trend stops and then it might increase, so that might be more precise for an older sale that experienced both. Which will make the reviewer's head explode.
 
While market condition adjustments have always been required when there is market support, the FHFA has tied the lack of supported time adjustments in certain markets to bias (FHFA Working Paper - Underappraisal Disparities and Time Adjustments). The Abstract of the Working Paper summaries:
“Mortgage appraisal accuracy became a major concern following the global financial crisis in the late 2000s. Legislative standards and industry guidance have adjusted professional practices to improve inefficiencies and inequities. Nonetheless, systematic misvaluation continues to be documented for single-family residential homes, which creates problems when appraisals are used by financial lenders to gauge potential risk and an asset’s worth. Real estate prices have been appreciating continuously over the last dozen years, which means comparable sales and benchmark indices merit revisions to reflect fair market conditions, but it only happens for around 10% of properties. We sample from a uniform appraisal database of over 45 million records from “subject” single-family properties and 228 million records from “comparable” homes covering the entire United States from 2015 through 2023. This paper asks whether time adjustments are made, if they improve fair market measurements, and whether they fix neighborhood appraisal disparities. Results show these readily available corrections are underutilized, too small, applied less frequently in minority areas, and cure half of initial underappraisals. The limited usage of time adjustment accounts for as much as 67% of the underappraisal bias in Black neighborhoods and 49% of the disparity in Hispanic neighborhoods”.
Therefore, the GSEs are making this a priority going forward. So much so that time adjustment “flags” for comparable sales will fire when an appraisal is submitted through UCDP without supported time adjustments.
 
What does be more precise mean?

A market shows a trend in prices over a period of 2 months, 6 months a year etc that overall, is stable, increasing or decreasing.

At some points a stable trend stops and then it might increase, so that might be more precise for an older sale that experienced both. Which will make the reviewer's head explode.
I agree, its like precision in claiming the market values a certain feature at $4,856 and instead you adjust $5,000 because you are lazy.
 

While market condition adjustments have always been required when there is market support, the FHFA has tied the lack of supported time adjustments in certain markets to bias (FHFA Working Paper - Underappraisal Disparities and Time Adjustments). The Abstract of the Working Paper summaries:

This sounds like BS. I got a revision saying something from some data was showing increased prices. All the comps were coming out similar whether they were older sales or more recent sales and under contracts showed no signs of an increase. Appraisal was at contract price. Oh but the neighborhood has a majority of minorities living there so I must of been biased. Perhaps their 'data' is the problem
 
Find a Real Estate Appraiser - Enter Zip Code

Copyright © 2000-, AppraisersForum.com, All Rights Reserved
AppraisersForum.com is proudly hosted by the folks at
AppraiserSites.com
Back
Top