Brian W Street
Junior Member
- Joined
- May 17, 2006
- Professional Status
- Licensed Appraiser
- State
- Indiana
Thanks, the Valuation Labs tool is what I am looking for. I need to search a bit more for Mr. Amorin's tool, and I will look into R Studio.
I have used Brandon's Trend Sheet since he came out with it, but unlike Spark, a monthly service, or TrueTracks, a soon-to-be monthly service, I was seeking something like his Trend Sheet that is not a monthly service. I am fully aware of my limitations in Excel; like you, I am also limited. The reason I was asking is if anyone has come up with a simple spreadsheet to accomplish this task. If I see the sheet and can play with it, I often can figure it out.I self taught myself excel just to do a simple chart. There is no way you can do a linear or more complicated non linear chart if you have not been doing excel before. It took the spark guy, an expert, months to get it right. I pay for the spark one, look at their videos. It puts the numbers in each comp & gives a page explanation of how w/charts.
There is no alternative method for these calculations. This is new from fannie, how many apps do you think are out there.
I can do the first part easily enough, but I am unsure what you mean by plotting the sales on the same graph. I appreciate the help, thanks!I either use True Tracts or I download MLS sales data in Excel.
I use XY chart. Then, I use 'Trendline' and 'Polynomial' with 2 order or 3 order, depending on the data. That gives me a good non-linear trendline pretty quickly.
Then, I plot the sales as another data set on the same graph so they show up on the curve.
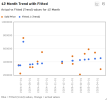
Check out this new AI spreadsheet tool. A bit like Google Sheets insofar as it's a web based application, but it has a built in AI assistant. Has a free version, but with very limited AI requests. $8 a month gets you unlimited AI requests. For the chart below, I uploaded a spreadsheet with Date and Price, then asked AI to graph date against price using date as the horizontal axis. Then I asked AI to fit the regression equation over the other series (this tool can't add a trendline like Excel can). Anyway - pretty nifty and could really lower the learning curve for learning Excel type applications.I can do the first part easily enough, but I am unsure what you mean by plotting the sales on the same graph. I appreciate the help, thanks!

You can spin the numbers from that graph.Check out this new AI spreadsheet tool. A bit like Google Sheets insofar as it's a web based application, but it has a built in AI assistant. Has a free version, but with very limited AI requests. $8 a month gets you unlimited AI requests. For the chart below, I uploaded a spreadsheet with Date and Price, then asked AI to graph date against price using date as the horizontal axis. Then I asked AI to fit the regression equation over the other series (this tool can't add a trendline like Excel can). Anyway - pretty nifty and could really lower the learning curve for learning Excel type applications.
View attachment 101613
Sorry - forgot to add the application: www.rows.com
brother, I have absolutely no idea what that means.You can spin the numbers from that graph.
You can't make conclusions from that graph.brother, I have absolutely no idea what that means.
really... well, you obviously know more than I, so I'll take you at your word.You can't make conclusions from that graph.
