• Welcome to AppraisersForum.com, the premier online  community for the discussion of real estate appraisal. Register a free account to be able to post and unlock additional forums and features.

1004MC Help Please

Status
Not open for further replies.

CaliforniaSD

Sophomore Member
Joined
Mar 11, 2022
Professional Status
Certified Residential Appraiser
State
California
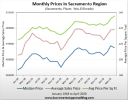
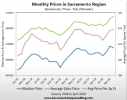
I am appraising a home in the hills that is causing me some trouble with the 1004MC and was hoping to get some suggestions from seasoned appraisers. I know that a lot of appraisers don't take the 1004MC seriously for time of sale market condition adjustments, but I have had a lot of good experience with it when I have a large amount of similar comparable sales. Anyhow, the MC results are not very reliable in this market due to the small amount of settled comparable sales: (7-12 months) 5 settled with median comparable sale price $2,496,923: (4-6 months) 2 settled with median comparable sale price $2,048,000: then it drastically drops (current-3 months) only 1 settled with median comparable sale price $1,537,500. There are two pending sales in the 2.2 range, and one is expected to close tomorrow, but this is after the effective date of appraisal. Then there is one active comp from the subject PUD that has been listed for 235 days and has had significant price drops from the original 2.5 million to the current 1.7 -2.2 range. There is not enough data to warrant an extreme adjustment based on lack of comparable sales. The market here is San Diego overall is very diverse by region, but overall it has been declining. Does anyone have any suggestions as to how to determine a supportable time of sale market condition adjustment? I personally think with the two pending sales, that the market can be considered stable for these high end homes. Thanks for your input.
 
Last edited:
Well, I enter what I think are appropriate parameters in the MLS program (FLEX), and when skinny results come up, lots 1's and 0's and blanks, I either report that with an explanation, or I widen the parameters and get another set of skinny data, like 1's and 3's and 5's, and report that. I tend to lien toward having parameters wide enough to make the MC look credible.
 
Well, I enter what I think are appropriate parameters in the MLS program (FLEX), and when skinny results come up, lots 1's and 0's and blanks, I either report that with an explanation, or I widen the parameters and get another set of skinny data, like 1's and 3's and 5's, and report that. I tend to lien toward having parameters wide enough to make the MC look credible.
Thanks for the feedback, I typically do the same thing but in this case the subject is in the hills and I have already covered all the hills possible. If I expand down into the flats, the values drop substantially and are not comparable. This is what is frustrating me. I think I will just report what I have and state that there is a pending that closed post effective date, and another pending that demonstrate stability in this market.
 
Does anyone have any suggestions as to how to determine a supportable time of sale market condition adjustment?
The first thing to do is throw that ****ed MC form away. It is a poor vehicle for determining a market conditions adjustment.

Use the MLS (assuming it has such a function- all I have used do in the past 20 years) Pick a population for a base market area and use the MLS function or transfer the data to Excel and run a plot over time with a trendline. Use the trend line. It will smooth out the roughness of the curve. It is idiotic to think that raw market data is going to not be rugose like the path of a staggering drunk. Smoothing it out will make it easier to index against the current date. Use as a plot. Include a snip of the chart. You have too little data to make a determination from the MC alone.
 
You could try researching competing neighborhoods. Maybe combine the outputs of several competing neighborhoods which collectively could be described as being part of the same market segment insofar as trend analysis goes.
 
You could try researching competing neighborhoods. Maybe combine the outputs of several competing neighborhoods which collectively could be described as being part of the same market segment insofar as trend analysis goes.
Yes, that is a good idea, I will research if there are any competing developments outside of the immediate subject market area and combine the outputs. Thanks!
 
use the MLS function or transfer the data to Excel and run a plot over time with a trendline. Use the trend line. It will smooth out the roughness of the curve.

The MC form only works with a lot of data because the analysis is so simplistic. It's a crappy form. When I use it, I include all sales from the neighborhood and not just the comparable sales. This usually makes the form better at demonstrating what the market is doing.

Terrel is right. Export MLS data and use excel to create graphs. It's not difficult and there are a ton of youtube videos. You only have to do it once and then you can use the same file as a template.

Here's a vid that shows you how to make the following chart.

1672618442168.png

Use excel. The alternatives aren't that great and are harder to figure out. Microsoft sells excel as a standalone program so you don't have to buy office.


Attachments

  • 1672618394496.png
    1672618394496.png
    168.5 KB · Views: 0
  • 1672618427639.png
    1672618427639.png
    171.5 KB · Views: 0
Excel is also the best tool to find resales that I know of. You can use conditional formatting to highlight cells with the same address.
 
You could try researching competing neighborhoods. Maybe combine the outputs of several competing neighborhoods which collectively could be described as being part of the same market segment insofar as trend analysis goes.
1004mc is supposed to be the subject's neighborhood.
The MC form only works with a lot of data because the analysis is so simplistic. It's a crappy form. When I use it, I include all sales from the neighborhood and not just the comparable sales. This usually makes the form better at demonstrating what the market is doing.

Terrel is right. Export MLS data and use excel to create graphs. It's not difficult and there are a ton of youtube videos. You only have to do it once and then you can use the same file as a template.

Here's a vid that shows you how to make the following chart.

View attachment 71131

Use excel. The alternatives aren't that great and are harder to figure out. Microsoft sells excel as a standalone program so you don't have to buy office.

MC form is for comparable sales. You can add another addendum with useful analysis. Just make it known that the MC form is not useful for market analysis and was included due to client requirements and the useful market analysis is elsewhere in the report.
 
MC form is for comparable sales. You can add another addendum with useful analysis. Just make it known that the MC form is not useful for market analysis and was included due to client requirements and the useful market analysis is elsewhere in the report.
I know I'm going against the writing on the form, but if I expand the search for MC then I have two sections in my appraisal that agree with each other (MC form and my own analysis). That's better than having one good section and one worthless section.

I got a random FHA review letter in the mail ~2021 and they didn't call me out on it. They just asked for more site value support, so since then I put land sales in the appraisal instead of just referencing my workfile.
 
Status
Not open for further replies.
Find a Real Estate Appraiser - Enter Zip Code

Copyright © 2000-, AppraisersForum.com, All Rights Reserved
AppraisersForum.com is proudly hosted by the folks at
AppraiserSites.com
Back
Top