• Welcome to AppraisersForum.com, the premier online  community for the discussion of real estate appraisal. Register a free account to be able to post and unlock additional forums and features.

MLS statistics

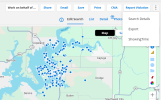
MLS allows you to download as a .csv file (comma separated value) which I then load into Excel. I eliminate most of the columns and then run a scatter chart and trendline.

is it possible to screen capture what it looks like after you load the file into Excel and show it here?
 
I run a a search under the Statistics menu in my MLS under Market Trends and it creates several charts and graphs, one of which is avg price per month. You can copy/paste any of the graphs into your report if you so desire.
 
So your argument is to not use statistical analysis because humans can't be trusted to use it meaningfully? I mean - I guess that's one way to deal with it. I'll admit that I tend to be too trusting that folks want to do the right thing, but often just don't understand how. You may be right, but I'll just continue to live in my fantasy world, I guess.
No, that's not at all what I said. The point is that some people use statistics to further an agenda or argument but they cherry pick the data that suits them best ala global warming or Algores graphs. Statistics are very easy to manipulate and, in the "wrong" hands, they can easily be completely useless, or worse, harmful.

Statistical analysis is very helpful in many scenarios. I'm skeptical about their value in real estate valuation other than for overall info for general market analysis. But, IMO, the same goes for regression analysis. I'd put more weight on the opinion of an experienced real estate broker for assistance in valuing real estate or a specific amenity.

But I suppose if you are really, really good with statistical and regression analysis, you could be as good of an appraiser as a forum member that always has his comps adjust to the exact number, out to the $1 level of precision. LOLOL!!!
 
Anybody know the 114MC rationale to group time periods during the previous 12 months into 3 rather than 4 groups? If not that, can somebody estimate the typical quantitative impact of disproportionate lengths of time?
Just another reason why the MC form is stupid.
 
I run a a search under the Statistics menu in my MLS under Market Trends and it creates several charts and graphs, one of which is avg price per month. You can copy/paste any of the graphs into your report if you so desire.

What are you basing the dollar adjustment on? are you taking the avg price of comparable sales on the effective appraisal date compared to the price of each sale on its contract date?

for example, say the effective date of 03/01/2025 showed an avg price of $500,000 and comp 1 went under contract in Sept 2024 when the avg price was $600,000. Are you making a -$100,000 adjustment to this comp?
This is for the market conditions adjustments. Difference (or not) between current average price for market vs average price for the pending month.

You make a % adjustment. divide the current average price by the pending month avg price 500/600=8.33 so the adjustment is -16.7%
 
This is for the market conditions adjustments. Difference (or not) between current average price for market vs average price for the pending month.

You make a % adjustment. divide the current average price by the pending month avg price 500/600=8.33 so the adjustment is -16.7%

What if there is only 1 comparable sale on the effective appraisal month? Then everything is being based on that 1 sale.
 
what info do you load into excel? the address? contract date? sale price?
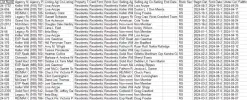
It downloads the entire file. I then have to delete the columns that are useless. You can filter the factors you want before you go do the download.

the download will look like this
Screenshot 2025-03-13 220055 (Small).png
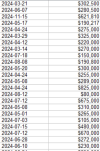
Then I just pare it down to the date and price
1741921570747.pngOf course, you can glean the outliers from the analysis to get better accuracy
 
Find a Real Estate Appraiser - Enter Zip Code

Copyright © 2000-, AppraisersForum.com, All Rights Reserved
AppraisersForum.com is proudly hosted by the folks at
AppraiserSites.com
Back
Top