• Welcome to AppraisersForum.com, the premier online  community for the discussion of real estate appraisal. Register a free account to be able to post and unlock additional forums and features.

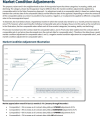
This is a pretty niffty detailed chart for finding time adjustments, we are done.

This:
"Depending on when the contract dateof the comparable sale(s) occurred, it is possible to have positive, negative, or no adjustments applied to different comparablesales in the same appraisal report."

Combined with this:
View attachment 94562


Might lead an unsuspecting appraiser to the conclusion that F/F do, in fact, recommend month over month analysis...
Its pretty simple really - If a monthly analysis was required, then that is what it would say. But, it does not say that.
Of course, I have seen enough USPAP-related posts over the years to know that some have a way of inserting their own words into requirements. :)
 
I get graphs that look like this sent to me almost monthly by agents in the markets where I'm an active buyer or seller. I laugh at them, they are just about meaningless compared to real life.

Oh well.
 
I'm not sure why everyone is getting worked up over this issue. The bar is now so low that anyone can clear it with room to spare. From the FNMA Selling Guide issued today, the actual requirements are:

"Time adjustments, or the lack thereof, must be supported by evidence. Use of home price indices (HPIs) to support time adjustments is consistent with our policy. The adjustment rates can also be determined through statistical analysis, modeling, paired sales, or other commonly accepted methods. The appraisal report must, at a minimum, summarize the supporting evidence and include a description of the data sources, tool(s), and technique(s) used."

The FHFA HPI calculator appears to cover the entire USA, so just put in State, MSA, quarter of sale, quarter of valuation, sale price, and Enter. An answer will appear on our screen.


Don't read the fine print:
"When using the FHFA House Price Calculator, please note that it does not project the actual value of any particular house. Rather, it projects what a given house purchased at a point in time would be worth today if it appreciated at the average appreciation rate of all homes in the area. The actual value of any house will depend on the local real estate market, house condition and age, home improvements made and needed, and many other factors. Consult a qualified real estate appraiser in your area to obtain a professional estimate of the current value of your home. Title XI of the Financial Institutions Reform, Recovery, and Enforcement Act of 1989 requires that any appraisal used in connection with a federally related transaction must be performed by a competent individual whose professional conduct is subject to supervision and regulation. Appraisers must be licensed or certified according to state law.

The FHFA House Price Calculator uses the FHFA Purchase-Only House Price Index (not seasonally adjusted) for all states, including the District of Columbia, and for the largest 100 Metropolitan Statistical Areas and Divisions. For all other Metropolitan Statistical Areas and Divisions the FHFA All-Transactions Index is used. For a list of the largest 100 Metropolitan Statistical Areas and Divisions, click here. For a discussion of the differences between the Purchase-Only Index and the All-Transactions Index, click here."

Ummmm ... I'd take that index with a "Cretacious-sized" grain of salt. ;) For fun I input our own home, bought in 2021, then asked for the estimate of its value today based on our City market area today ... spoiler ... it came in about 80K ABOVE the actual market value (I wish) ... useless ...

*EDIT* - When I moved it up to 3rd Q 2023, the value it spit out was actually pretty close to market - and 90K less than the earlier estimate (which was undoubtedly skewed by the insane appreciation going on in early 2021 that it was miscalculating). So now I reserve judgment - I guess it works - sometimes (and that is why we still have jobs)
 
Ummmm ... I'd take that index with a "Cretacious-sized" grain of salt. ;) For fun I input our own home, bought in 2021, then asked for the estimate of its value today based on our City market area today ... spoiler ... it came in about 80K ABOVE the actual market value (I wish) ... useless ...
*EDIT* - When I moved it up to 3rd Q 2023, the value it spit out was actually pretty close to market - and 90K less than the earlier estimate (which was undoubtedly skewed by the insane appreciation going on in early 2021 that it was miscalculating). So now I reserve judgment - I guess it works - sometimes (and that is why we still have jobs)
 
Its pretty simple really - If a monthly analysis was required, then that is what it would say. But, it does not say that.
Of course, I have seen enough USPAP-related posts over the years to know that some have a way of inserting their own words into requirements. :)
The concept is simple. Not sure I agree that the delivery of the message reinforces the simplicity, though.
 
Are they really supporting a time adjustment based on 4 comps?
No, that is not how it works. One analyzes data and then looks at the trend from that data.

1734010047177.png

In this case, the trend is shown by the blue line. The dots represent where the market was as the time each comparable went under contract. Comparing where the market was when the comp was contracted to where the market is on the effective date of the appraisal yields the indicated adjustment for each comp.
 

It is not linear.


Find a Real Estate Appraiser - Enter Zip Code

Copyright © 2000-, AppraisersForum.com, All Rights Reserved
AppraisersForum.com is proudly hosted by the folks at
AppraiserSites.com
Back
Top