• Welcome to AppraisersForum.com, the premier online  community for the discussion of real estate appraisal. Register a free account to be able to post and unlock additional forums and features.

CRMLS INFOSPARKS "My Areas" Functionality

Status
Not open for further replies.
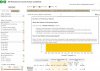
There's a "live" Fannie MC for you to fill out using comps in the neighborhood. When there are not enough sales for meaningful statistical analysis, I run an MC report from MLS with whatever data I think most appropriate. I print to pdf and import the pdf into the report. So I have "two" MC forms in the same report. I refer to it as a "Supplemental Market Analysis."
--
Sorry, I was referring to the "Market Conditions" narrative that is spills-over into the long addendum page that doesn't do well with imported data based on my experience and confirmed by ACI technical support . . . although the Fannie MC you reference sounds cool and I will follow-up . . . just when I was trying to figure out a way to shorten reports and lengthen my lifespan . . .
 
I know what you mean. It’s a pain having to flip back and forth between the narrative and graphs etc. I have used Spark (which I think is in ACI). And it does put the narrative next to your graphs or table, so it does save time. I’m interested in CANative’s method. Maybe putting it all into a Word document and creating a PDF and inserting it into the report is the best way to go. Might try it next time. :)
---

Yep. Question: how do you even import published charts/graphs/tables into an image page? I try to download to my desktop or create a word doc, or create a PDF, or use the Snipping Tool, but the image never seems to format correctly once I upload in into ACI, although I'm mid-way into Spark for Appraisers functionalilty and am totally down with the concept, specially esoteric meaningless **** such as sthe prior transfer history of all comparables that takes forever.
 
In Matrix, I use the stats tool which has a lot of granular data if used right. I also use InfoSparks which can go back 11 or 12 years.

These are not just "click buttons and out pops a market analysis" tools. It has to be done thoughtfully. Med and average sales, volume of sales, inventory (based on closed sales and based on pended sales), DOM trend, etc., etc.

I make little screen shots and transfer those to a Word template.

View attachment 42459


View attachment 42460

-----

Awesome features about the Infosparks charts is 1) the user can display various markets simultaneously, such as subject county, city, zip, and interactively-create 'hood; and 2) holding the cursor at each increment along the trend line displays actual numbers so the user isn't required to estimate, which require ANOTHER caveat IMO...

I have to use 3 MLS systems to cover my territory. Matrix is one. A small area of Mendocino County uses something like (but not the same) as Matrix. The main MLS is called BAREIS (Bay Area Real Estate Information system) uses Rappatoni. Their trend tools are pretty cool and completely customizable (not a word.) If you hoover the mouse over certain metrics, a little window will drop down and tell you how, why and when to use it and in connection with other metrics. For instance, say how DOM, absorption rate, and inventory work together and how to interpret the results.

Pretty cool (in a wonky sort of way.)
 
---

Yep. Question: how do you even import published charts/graphs/tables into an image page? I try to download to my desktop or create a word doc, or create a PDF, or use the Snipping Tool, but the image never seems to format correctly once I upload in into ACI, although I'm mid-way into Spark for Appraisers functionalilty and am totally down with the concept, specially esoteric meaningless **** such as sthe prior transfer history of all comparables that takes forever.

I just use the snapshot tool in Adobe and paste into a ClickForms exhibit page. Spark should automatically insert these images and narrative for you. At least it does in CF.
 
Months of inventory
 

Attachments

  • moi.JPG
    moi.JPG
    196.5 KB · Views: 4
I just use the snapshot tool in Adobe and paste into a ClickForms exhibit page. Spark should automatically insert these images and narrative for you. At least it does in CF.

You can make a pdf and then use the "Insert from PDF" function. This allows to import a multi-page pdf.
 
Yes that’s what I usually do . But ZZ was having issues trying to insert images. So that’s why I suggested the snapshot tool.

I have to check and see if info-sparks is available in my MLS. It looks good and can potentially save me some money. Since Spark is subscription based.
 
Which County do you mostly work. I can see if it's in the infosparks list.
 
Mostly in Broward County, Miami -Dade and a little in Key West(Monroe County).
 
Status
Not open for further replies.
Find a Real Estate Appraiser - Enter Zip Code

Copyright © 2000-, AppraisersForum.com, All Rights Reserved
AppraisersForum.com is proudly hosted by the folks at
AppraiserSites.com
Back
Top