ZZGAMAZZ
Elite Member
- Joined
- Jul 23, 2007
- Professional Status
- Certified Residential Appraiser
- State
- California
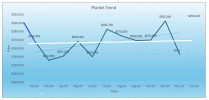
Not sure if I can express this qustion; however....I successfully rely on various Spark chartts; however in the past whenever I created my own charts, e.g., using Excel, and then downloaded PDF to desktop and then uploaded to an ACI photo or image page [with multiple cells] the charts would inevitably be truncated to display only a portion of the entire horizontal data. Any Advice?????Never messed with Flex, but I've thoroughly reviewed Smart Charts, and while they are interesting, I don't find them reliable for what I need. Likewise, I've messed around with the stats in Spark, which are pretty good. Ultimately though, I roll my own. It doesn't take that long and I'm able to exclude outliers that perhaps snuck in there due to false settings by agents (like water view when there's no view, etc.).


