All I see on the news is "record heat" blah blah blah. Nonsense. Virtually all of them are looking ONLY at the last 40 years. Why? Because that was about the time we had a period of below average temperatures. There are 10,800 weather stations more or less in the US. We've got pretty good records for about 120 years. Each day of each year has the opportunity to set a low or high at any of the 10,800 stations. Shear serendipity suggests that a few "record" highs and lows will be set every single day of the year. Now limit that to only the previous 40 years and that number triples. NOAA uses a database of about 1,200 of the above stations to do their annual analysis.
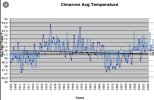
This is Cimarron, NM temperature chart - it's pretty typical. It's actually falling. (this is from the NM Meteorological office.)

The high-low (average) temperature is mostly unchanged where the surrounding landscape is unchanged where as a large city where the temperature stations has had large changes in asphalt, nearby parking lots, buildings reflecting heat etc. are increasing slowly. By one estimate about 85% of stations are compliant with NOAAs own standards for siting of a weather station.
Sacratomato is supposed to hit 109 Saturday and 108 Sunday
That's no record - last year was hotter but it has been above 109 numerous times.
The highest temperature and hottest day for each year in Sacramento.

www.currentresults.com
Dr. Roy Spencer website (Spencer's research is funded by NOAA and he is Principal Research Scientist at Univ. of Alabama and past NASA scientist.
SUMMARY: The Urban Heat Island (UHI) is shown to have affected U.S. temperature trends in the official NOAA 1,218-station USHCN dataset. egression analysis applied to the ISD hourly weather data (mostly from airports)Â between many stations’ temperature trends and local population density (as a UHI proxy) can be used to remove the average spurious warming trend component due to UHI. Use of the hourly station data provides a mostly USHCN-independent measure of the U.S. warming trend, without the need for uncertain time-of-observation adjustments. The resulting 311-station average U.S. trend (1973-2020), after removal of the UHI-related spurios trend component, is about +0.13 deg. C/decade, which is only 50%Â the USHCN trend of +0.26 C/decade. Regard station data quality, variability among the raw USHCN station trends is 60% greater than among the trends computed from the hourly data, suggesting the USHCN raw data are of a poorer quality. It is recommended that an de-urbanization of trends should be applied to the hourly data (mostly from airports) to achieve a more accurate record of temperature trends in land regions like the U.S. that have a sufficient number of temperature data to make the UHI-vs-trend correction.


