Joe Flacco
Elite Member
- Joined
- Jul 31, 2013
- Professional Status
- Certified Residential Appraiser
- State
- Maryland
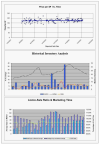
There are several. Back when I as still in the field, I had software that would allow me to, in a short time, import data, analyze trends for any market segment I wanted, and produce similar graphs and/or other relevant graphs or charts. Certainly what is available now is even better than what was available 15 years ago.Excuse my ignorance but is there a software program available to appraisers that would generate that graph for a easy copy paste solution? Or does FNMA expect the appraiser to analyze the market and manually produce that graph.
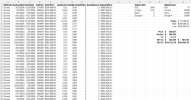
It means that even the data on that nifty graph developed by F/F could be fitted into a linear model, but F/F is intimating that is rather lazy. For instance, for the data set below, if calculating the MoverM delta, the 'correct' methodology - based on the F/F guidance - would be to apply market adjustments as follows:What does be more precise mean?
A market shows a trend in prices over a period of 2 months, 6 months a year etc that overall, is stable, increasing or decreasing.
At some points a stable trend stops and then it might increase, so that might be more precise for an older sale that experienced both. Which will make the reviewer's head explode.


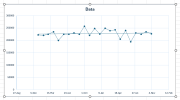
Those are good and these kinds of trend charts are avail from MLS or software etc , but they ar not the individual property house specific comp by address chart like the one was posted on the example from Fannie - I hope that never becomes an expectation.Not hard to do in Excel. I've included these in every report where sufficient data exists to do so since 2009, shortly after the release of the 1004 MC addendum. I feel it's better to analyze the market with some sort of "value indication" instead of simply "price" so I graph price per SF over time.
View attachment 94554
If it does, there will be plenty of software providers out there rushing to fill that void. The 1004 MC requirement spawned many different software solutions, and the one that you are worried about above should be no different.Those are good and these kinds of trend charts are avail from MLS or software etc , but they ar not the individual property house specific comp by address chart like the one was posted on the example from Fannie - I hope that never becomes an expectation.
This is nice, but not really what they're looking for, as your scatter plot is on a continuum. They're looking for those sales to be grouped together by month and then the trend adjustments applied based on a delta between a particular month and the current baseline.Not hard to do in Excel. I've included these in every report where sufficient data exists to do so since 2009, shortly after the release of the 1004 MC addendum. I feel it's better to analyze the market with some sort of "value indication" instead of simply "price" so I graph price per SF over time. Of course, when the market segment being analyzed contains substantial nonresidential components such as large site sizes, outbuildings, or external site considerations which affect value, this simple "price/sf analysis" doesn't tell the whole tale.
View attachment 94554
I'm not sure why everyone is getting worked up over this issue. The bar is now so low that anyone can clear it with room to spare. From the FNMA Selling Guide issued today, the actual requirements are:
"Time adjustments, or the lack thereof, must be supported by evidence. Use of home price indices (HPIs) to support time adjustments is consistent with our policy. The adjustment rates can also be determined through statistical analysis, modeling, paired sales, or other commonly accepted methods. The appraisal report must, at a minimum, summarize the supporting evidence and include a description of the data sources, tool(s), and technique(s) used."
The FHFA HPI calculator appears to cover the entire USA, so just put in State, MSA, quarter of sale, quarter of valuation, sale price, and Enter. An answer will appear on our screen.

FHFA House Price Index® Datasets | FHFA
The FHFA House Price Index (FHFA HPI®) is a comprehensive collection of publicly available house price indexes that measure changes in single-family home values based on data that extend back to the mid-1970s from all 50 states and over 400 American cities. The FHFA HPI incorporates tens of...www.fhfa.gov
Don't read the fine print:
"When using the FHFA House Price Calculator, please note that it does not project the actual value of any particular house. Rather, it projects what a given house purchased at a point in time would be worth today if it appreciated at the average appreciation rate of all homes in the area. The actual value of any house will depend on the local real estate market, house condition and age, home improvements made and needed, and many other factors. Consult a qualified real estate appraiser in your area to obtain a professional estimate of the current value of your home. Title XI of the Financial Institutions Reform, Recovery, and Enforcement Act of 1989 requires that any appraisal used in connection with a federally related transaction must be performed by a competent individual whose professional conduct is subject to supervision and regulation. Appraisers must be licensed or certified according to state law.
The FHFA House Price Calculator uses the FHFA Purchase-Only House Price Index (not seasonally adjusted) for all states, including the District of Columbia, and for the largest 100 Metropolitan Statistical Areas and Divisions. For all other Metropolitan Statistical Areas and Divisions the FHFA All-Transactions Index is used. For a list of the largest 100 Metropolitan Statistical Areas and Divisions, click here. For a discussion of the differences between the Purchase-Only Index and the All-Transactions Index, click here."
That's the rub - how granular do you get before modeling price trends. Do you just take raw sales prices for a particular geography and model them? Do you just model those sales that would be considered 'comparable' to the subject (as was the guidance for the 1004MC), or do you 'adjust' your dataset to account for differences in elements of comparison prior to modeling price trends? Been playing with a model where I adjust the data set to the subject and THEN apply a trend analysis. Not sure yet if that's just a lot of extra work or not. The model looks like this:Looking at real estate trends using just sale prices over time can really give you the wrong idea about what’s happening in the market. One big problem is that the properties being sold at any given time aren’t all the same. If you don’t consider the differences in property characteristics—like size, condition, age, or even if a home was recently renovated—you’re likely to end up with a very skewed perspective.

