• Welcome to AppraisersForum.com, the premier online  community for the discussion of real estate appraisal. Register a free account to be able to post and unlock additional forums and features.

This is a pretty niffty detailed chart for finding time adjustments, we are done.

Note that a refinance is now a sale. Wonder if the price is appraised value? Mortgage amount?

What does the FHFA HPI represent?​


The FHFA HPI is a broad measure of the movement of single-family house prices. The FHFA HPI is a weighted, repeat-sales index, meaning that it measures average price changes in repeat sales or refinancings on the same properties. This information is obtained by reviewing repeat mortgage transactions on single-family properties whose mortgages have been purchased or securitized by Fannie Mae or Freddie Mac since January 1975.
So its even worse then I thought it was.
 
Note that a refinance is now a sale. Wonder if the price is appraised value? Mortgage amount?

What does the FHFA HPI represent?​


The FHFA HPI is a broad measure of the movement of single-family house prices. The FHFA HPI is a weighted, repeat-sales index, meaning that it measures average price changes in repeat sales or refinancings on the same properties. This information is obtained by reviewing repeat mortgage transactions on single-family properties whose mortgages have been purchased or securitized by Fannie Mae or Freddie Mac since January 1975.
I've seen actual AVM outputs such as this. They would take the mortgage amount from a refinance three years ago and apply time adjustments to it and claim that's reliable data. It's no wonder they want to keep all these black box algorithms secret.
 
While market condition adjustments have always been required when there is market support, the FHFA has tied the lack of supported time adjustments in certain markets to bias (FHFA Working Paper - Underappraisal Disparities and Time Adjustments). The Abstract of the Working Paper summaries:

This sounds like BS. I got a revision saying something from some data was showing increased prices. All the comps were coming out similar whether they were older sales or more recent sales and under contracts showed no signs of an increase. Appraisal was at contract price. Oh but the neighborhood has a majority of minorities living there so I must of been biased. Perhaps their 'data' is the problem
That is the scary part, using this to pressure appraisers into over-appraising properties -
what is contained in the post 28
I have no problem getting a bit more granular with time adjustments, but this sounds punitive, red flag returns of reports if they don't see time adjustments etc.
 
I've seen actual AVM outputs such as this. They would take the mortgage amount from a refinance three years ago and apply time adjustments to it and claim that's reliable data. It's no wonder they want to keep all these black box algorithms secret.
Prices rise like a helium balloon and prices also are all over the place with people paying more for an avg condition home than an upgraded one etc

Applying time adjustments as they recommend to avoid "under appraising" might as well go back to mortgage broker days I need a really high value !1 Which is what the WAIVERS seems geared for r ( as long as it fits in a range of an AVM and what oversight is there of the AVM, how sees it outside of FF?)

Every new high-price sale can become a benchmark price for other comps, whether in an appraisal or an AVM.
 
That is the scary part, using this to pressure appraisers into over-appraising properties -
what is contained in the post 28
I have no problem getting a bit more granular with time adjustments, but this sounds punitive, red flag returns of reports if they don't see time adjustments etc.
My guess is they use a wide area and prices overall are increasing, but its tons of markets and not useful for a specific one.
 
Excuse my ignorance but is there a software program available to appraisers that would generate that graph for a easy copy paste solution? Or does FNMA expect the appraiser to analyze the market and manually produce that graph.
 
Excuse my ignorance but is there a software program available to appraisers that would generate that graph for a easy copy paste solution? Or does FNMA expect the appraiser to analyze the market and manually produce that graph.

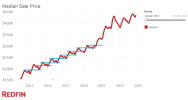
That is just the way the market behaves. Should be common knowledge but it is not for some reason.
 
1733942442055.png

Prices are in a range for most of the year and then in the spring prices get bid up into a new range. It is those months when it is moving into a new range when appraisals below contract price are more common.
 
  • Like
Reactions: DTB
Excuse my ignorance but is there a software program available to appraisers that would generate that graph for a easy copy paste solution? Or does FNMA expect the appraiser to analyze the market and manually produce that graph.
See post #23
 
Find a Real Estate Appraiser - Enter Zip Code

Copyright © 2000-, AppraisersForum.com, All Rights Reserved
AppraisersForum.com is proudly hosted by the folks at
AppraiserSites.com
Back
Top