• Welcome to AppraisersForum.com, the premier online  community for the discussion of real estate appraisal. Register a free account to be able to post and unlock additional forums and features.

This is a pretty niffty detailed chart for finding time adjustments, we are done.

This is nice, but not really what they're looking for, as your scatter plot is on a continuum. They're looking for those sales to be grouped together by month and then the trend adjustments applied based on a delta between a particular month and the current baseline.
I know, that wasn't what they were looking for in 2008 when I started working on those, however. When I get the time, I will probably bump this up to three years instead of two, and add another couple of procedures to analyze a point value from a specific timeline. Shouldn't be too difficult. To your point above, I believe all such results should be modeled after the dataset is adjusted for quantifiable differences, only then would value indicators be a legitimate basis for comparison. Just working with raw "prices" is a waste of time, in my opinion.
 
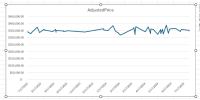
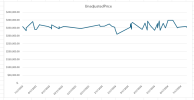
And here are the trends. First is adjusted price trend and second is unadjusted price trend. On first blush, it seems all the extra work of adjusting for differences doesn't make that much difference...

1733946316514.png

1733946344853.png
 
If you can't scrub the data and remove the high and low anomalies in that FHFA index data set, it may backfire against what I believe they're trying to do (significantly increase values in minority neighborhoods).

Using alebrewer's graph in post #43, if the effective date is between April and July, the homeowners are going to be extremely unhappy. More cries of bias will be heard.

The extreme high and lows will not be representative of the markets typical values. That's everywhere, no matter the location.
 
Anyone can put something on a spreadsheet and draw a line through it. Whether isn’t actually reflects the market is another question.

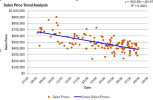
The below example was posted online by a well-known educator. If I saw this in an appraisal from 23/24, I would probably be calling the appraiser to discuss.

1733947277488.png
 
Looking at real estate trends using just sale prices over time can really give you the wrong idea about what’s happening in the market. One big problem is that the properties being sold at any given time aren’t all the same. If you don’t consider the differences in property characteristics—like size, condition, age, or even if a home was recently renovated—you’re likely to end up with a very skewed perspective.


Think about it: if a bunch of fully remodeled, luxury homes sell this year, but last year most of the sales were smaller, older homes, it might look like prices are skyrocketing. But in reality, it’s not that every property is suddenly worth more—it's just that more expensive homes are dominating the sales. The opposite is true too. If more fixer-uppers hit the market during a certain period, prices might look like they’re dropping when, really, they’re just reflecting the condition of the homes being sold.


That’s why it’s so important to dig deeper and account for these differences. Using tools like multi-variable regression can help because they look at how things like size, age, and features affect prices, while also accounting for trends over time—even if those trends aren’t perfectly straight lines. It’s a way to separate what’s happening with property values from what’s just noise in the data. Otherwise, you’re really just guessing based on surface-level patterns, and that can lead to some pretty misleading conclusions.

Yeah, much like when they introduced the 1004MC Fannie has no clue what they are doing.
There can also be different price trends between fixer uppers and renovated homes, and one may lag behind the other in trends. Other factors can give clues like shorter or longer DOM than typical and selling way above or way below list prices in general.
 
I know, that wasn't what they were looking for in 2008 when I started working on those, however. When I get the time, I will probably bump this up to three years instead of two, and add another couple of procedures to analyze a point value from a specific timeline. Shouldn't be too difficult. To your point above, I believe all such results should be modeled after the dataset is adjusted for quantifiable differences, only then would value indicators be a legitimate basis for comparison. Just working with raw "prices" is a waste of time, in my opinion.
I recall reading a bulletin where they only want the past year used for a time adjustment.
 
If you can't scrub the data and remove the high and low anomalies in that FHFA index data set, it may backfire against what I believe they're trying to do (significantly increase values in minority neighborhoods).

Using alebrewer's graph in post #43, if the effective date is between April and July, the homeowners are going to be extremely unhappy. More cries of bias will be heard.

The extreme high and lows will not be representative of the markets typical values. That's everywhere, no matter the location.
Yeah, when they introduced that graph and associated explanation, they really opened most folks' eyes. I know of no one, prior to that being released, that modeled time adjustments to the month (as opposed to applying some kind of smoothing technique). And the more I play with the idea, the more I'm convinced that you really do need to apply some kind of smoothing technique to take out some of the variability - especially the variability that is associated with a data set with fewer observations.
 
If you can't scrub the data and remove the high and low anomalies in that FHFA index data set, it may backfire against what I believe they're trying to do (significantly increase values in minority neighborhoods).

Using alebrewer's graph in post #43, if the effective date is between April and July, the homeowners are going to be extremely unhappy. More cries of bias will be heard.

The extreme high and lows will not be representative of the markets typical values. That's everywhere, no matter the location.
This is wrong!!

We should not be setting out to increase value nor decrease values in some neighborhoods and not others!!
 
If they are, they probably shouldn't frame the issue as having anything to do with minority neighborhoods. But appraisal reports missing the market at a higher rate in the spring is factual.

At the time of the appraisal, it is just an appraisal below the contract price. Looking backwards with the benefit of 2-3 more months of data, they are low appraisals.
 
There is no requirement for an illustration. The requirement is to include support for the reported market conditions and market condition (time) adjustments (or lack thereof). Using an illustration is one possible way to show support.

The illustration in the announcement was based, in part, on what some include in actual appraisal reports today. Of course, the level of analysis one can do depends on the available data in the market area.
Let the hate begin.

I like the fannie example. In my market, appraisers should have been making adjusts for seasonal trends forever. In normal times, prices go up in spring, summer and decline in winter.

Why didn't we do it? Push back by lenders. It always comes back to lenders.

Same when rates went up in fall of 2022, prices declined and by spring, consumers got used to them and prices went back up.

So why are appraisers so up set? The gses are telling lenders to f off and let appraisers make adjustments. On the other hand, the gses are telling fernando to make market condition adjustments.

We have the green light.

Ps.....the gses have got to stop lenders from trying to improve the CU score. Rural now appears to be when appraisers have to go over two miles for comps...here we go again.
 
Find a Real Estate Appraiser - Enter Zip Code

Copyright © 2000-, AppraisersForum.com, All Rights Reserved
AppraisersForum.com is proudly hosted by the folks at
AppraiserSites.com
Back
Top