• Welcome to AppraisersForum.com, the premier online  community for the discussion of real estate appraisal. Register a free account to be able to post and unlock additional forums and features.

Overall Market Trend (Min 12 months)

Be cautious about who you do business with. True Footage may be one of Fannie's preferred partners, but they face serious issues with the states.

1739422741255.png

 
Last edited:
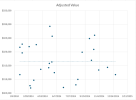
Didn't want to start a new thread on this, so attaching it here. In the continuing evolution of the market analysis conundrum, should anyone desire to 'mirror' the monthly delta chart espoused by the GSE's, it takes about 15 minutes in Excel to develop the below. From a data set of ~ 50 observations, I built an Excel sheet (and formula) to adjust for elements of comparison. The equation for the 'adjusted' values is as follows: '=I2+(($Q$2-A2)*$R$2)+(($Q$3-C2)*$R$3)+(($Q$4-E2)*$R$4)+(($Q$5-F2)*$R$5)+(($Q$6-G2)*$R$6)+(($Q$7-H2)*$R$7)'. The resulting 'adjusted price' scatter plot looks like this:
1739974362332.png

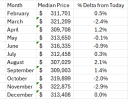
From there, I applied the 'median' formula (=median(xn:xn)) which calculates the median price for each month. Then, to calculate the delta, I applied the following formula: '=($H$40-H30)/H30' and copy the formula through the months to arrive at the following:

1739974545197.png

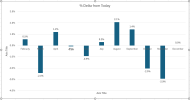
Then you just have to generate a graph from that data. It looks like this:

1739974589093.png

Generates a very cool chart, but I just haven't figured out how to make it 'plug and play' where you can drop an XLS or CSV file into it and have it all run systematically.
 
Didn't want to start a new thread on this, so attaching it here. In the continuing evolution of the market analysis conundrum, should anyone desire to 'mirror' the monthly delta chart espoused by the GSE's, it takes about 15 minutes in Excel to develop the below. From a data set of ~ 50 observations, I built an Excel sheet (and formula) to adjust for elements of comparison. The equation for the 'adjusted' values is as follows: '=I2+(($Q$2-A2)*$R$2)+(($Q$3-C2)*$R$3)+(($Q$4-E2)*$R$4)+(($Q$5-F2)*$R$5)+(($Q$6-G2)*$R$6)+(($Q$7-H2)*$R$7)'. The resulting 'adjusted price' scatter plot looks like this:
View attachment 96978

From there, I applied the 'median' formula (=median(xn:xn)) which calculates the median price for each month. Then, to calculate the delta, I applied the following formula: '=($H$40-H30)/H30' and copy the formula through the months to arrive at the following:

View attachment 96979

Then you just have to generate a graph from that data. It looks like this:

View attachment 96980

Generates a very cool chart, but I just haven't figured out how to make it 'plug and play' where you can drop an XLS or CSV file into it and have it all run systematically.
Sorry, but for all the effort, the dots and graph doesn't show a clear trend of anything - they show individual sales as dots and then bars spiking or sinking in a short time frame. The only thing that makes sense is the median prices, which are very similar to each other (rare here) and show almost no change overall from Feb-Dec.

The median price list shows a stable trend and seems the most reliable.

Imo this over-complication suggested is producing results that some are casting about to replicate any way they can, while skipping actual analysis of both the overall trend on page one in the neighborhood and the trend that affects the comps and most similar properties to the subject (the comps may or may not be located in the neighborhood defined on page one)
You don't need to apologize for me trying to help others, J. Just don't post.
 
You don't need to apologize for me trying to help others, J. Just don't post.
I know you are trying to help, and so do I - I just find these overly complex charts and graphs are not producing credible trend results and are affected by short-term spikes or dips in prices.
 
I know you are trying to help, and so do I - I just find these overly complex charts and graphs are not producing credible trend results and are affected by short-term spikes or dips in prices.
If you know someone is trying to help others - don't poopoo their posts. It's ok to keep your negative opinions to yourself. Others are plenty smart enough to decide whether they want to use the info or not.
 
I don't see a pay raise coming for this extra work. I'm also not confident about non linear monthly adjustments. Fannie hasn't come out with a promised update on which to use, having shown the non linear chart the 1st time. You need a program to do it, not an hour worth of work. I've always had plenty of trend data in my report. Gonna stick with a linear time adjustment which i get in less than a minute. I wonder how the lender knows which way you go, or will fannie send a red check mark, not matching their numbers.
 
I don't see a pay raise coming for this extra work. I'm also not confident about non linear monthly adjustments. Fannie hasn't come out with a promised update on which to use, having shown the non linear chart the 1st time. You need a program to do it, not an hour worth of work. I've always had plenty of trend data in my report. Gonna stick with a linear time adjustment which i get in less than a minute. I wonder how the lender knows which way you go, or will fannie send a red check mark, not matching their numbers.
Since Fannie has not specifically insisted we must use lindera adjustments, I will not use them unless there is a compelling reason in a specific case.

I watched the true tracts spark video using a "heat map" to do it and was horrified - it had little or northing to do with trends and the amount of data it needed could distort results.
 
I don't see a pay raise coming for this extra work. I'm also not confident about non linear monthly adjustments. Fannie hasn't come out with a promised update on which to use, having shown the non linear chart the 1st time. You need a program to do it, not an hour worth of work. I've always had plenty of trend data in my report. Gonna stick with a linear time adjustment which i get in less than a minute. I wonder how the lender knows which way you go, or will fannie send a red check mark, not matching their numbers.
In general I'd agree, but I actually did one last week where the non-linear adjustments resulted in a tighter adjusted range than linear. It seems to me that's what they're looking for - not necessarily one or the other, but the one that offers the best fit. Some on AF, I think, poo-poo the non-linear approach because they don't understand how to develop it. But: (a) its really not that hard to do, (b) it really doesn't take that much time to do it, (c) it's probably something most should have at least been considering this entire time, and (d) turns out that there are actually times that a non-linear approach works as well (or better) than the linear approach.
 
On u tube: Spark Spotlight: Linear and Non-Linear Time Adjustments

I just watched the final time trend video for Spark. It will do linear or non linear time adjustment. I have learned a bit from watching the video. There is a little more decision making to how you look at the trend line in a nonlinear way.

Which ever way you go, it will give you an addendum with the chart and explanation of each month % number.
Ok, this is perfect and takes about 1 minute with the adjustment & explanation automatically put into the report.
 
Find a Real Estate Appraiser - Enter Zip Code

Copyright © 2000-, AppraisersForum.com, All Rights Reserved
AppraisersForum.com is proudly hosted by the folks at
AppraiserSites.com
Back
Top