• Welcome to AppraisersForum.com, the premier online  community for the discussion of real estate appraisal. Register a free account to be able to post and unlock additional forums and features.

Overall Market Trend (Min 12 months)

The heat map scatter shot sensitivity by the month they claim is about better price accuracy - except that appraisers, we are not in the price business; we are in the market value opinion business - an accurate "price" may not be the same as a credible market value opinion.
 
Wrt year over year - it not what the GSE's require - if an appraiser wants to additionally talk about it then do so, however, it has no real bearing on making time/market condition adjustments from comps that typically sold within the past year up to today's recent market trend indicator and making prices equivalent from past month sales if they have been changed in the market since their contracts were negotiated..

It does bring up an interesting point, though if a comp is 18 months old, then it would make sense to analyze that older sale date prior on a situation-by-situation basis.

It does have a bearing on the adjustment because what the data may appear to show over 12 months is not what is actually happening with values.
 
If a plant closes in month 9 and the market makes a rapid decline but was up overall still??? I don't know what do you think?
We are supposed to identify and explain the trend that affects our particular subject market ( in this place, a plant closing ) , when it differs from an overall trend, and why.

That is a depth of market analysis that appraisers offer over big data/machines. If an appraiser can not do that, or does not understand the reason for it -lack of competence or lazy imo
 
1738429315584.png

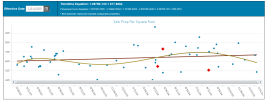
I never used this before but I took a look at it after the poster in the other thread posted their datamaster screenshot.

Now going into the spring market, this is showing a 10% negative adjustment from July / August to today. That is not what is happening.

I think there is a good chance they are going to end up backtracking on this quickly if their objective is that fewer appraisals are going to be less than contract price.
 
View attachment 96171

I never used this before but I took a look at it after the poster in the other thread posted their datamaster screenshot.

Now going into the spring market, this is showing a 10% negative adjustment from July / August to today. That is not what is happening.

I think there is a good chance they are going to end up backtracking on this quickly if their objective is that fewer appraisals are going to be less than contract price.
Notice the GSEs never complain about appraisers not doing a downward adjustment, they complain they are not inflating it enough.
 
1738430163236.png

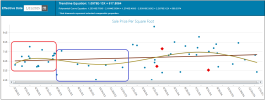
The dots in the red box that pull up the curve and the dots in the blue box that pull down the curve are not the same.

So what we have above in the red box represents the spring season, the most active time of year for real estate transactions. Then for the remainder of the year in the blue box, you see that the dots are towards the lower end of the range curving the line back down. It is generally fewer transactions during that time and the properties that trade around that time tend to be inferior to the properties that trade in the spring. That is why the dots are lower. The dots are lower because they are inferior properties, not because they are equivalent properties as the upper end of the range sales in the red box but trading for less. Prices and values are not declining from the red box to the blue box.

Understanding that this is the cause for the shape of the curve and the change in median price data over the year is very important.
 
Find a Real Estate Appraiser - Enter Zip Code

Copyright © 2000-, AppraisersForum.com, All Rights Reserved
AppraisersForum.com is proudly hosted by the folks at
AppraiserSites.com
Back
Top