If quantify is the basis, then having say 5 categories suggests 100% 80% 60% 40% 20% 0% - that's a pretty broad range, especially when you are striving for 5% accuracy range... So, do we use C1-C20? Do we do like school grades and grade on the curve? Do we say 50% is failing and tighten the designations up to 10% within each range. I mean all this is subjective no matter how you slice the cake. At least Bert's suggestion is based upon a numerical calculus.
Which is exactly the problem.
Percent of what? You don't want any categories!! Because a category implies a definition, which invariably requires subjective judgement.
If you are saying: We are going to RANK these properties by residual, and then divide the ranking into classes by your percentages, - I am going to say, well if I decide to expand my definition of the Market Area, all of these classifications would very well change. In fact, in the initial analysis stage, we may discover information that indicates we need to contract or expand our definition of the subject market area for all kinds of reasons. That can have unpleasant downstream effects. To have your properties in the Sales Grid when you do occasional revisions can be problem. But if the score changes from 7.92 to 8.05, because you altered the market area, --- yes that would be acceptable, no one would question that. You don't really need to explain that particular change, you just say you decided to expand the market area for this or that reason, and the change resulted in a slight change to the scores. Acceptable!
Let's get away from categories, because we really don't need them. They are just a headache.
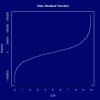
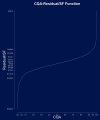
Besides, CQA scores based on ranking properties by Residual (or better Residual/SF) produce Residual/CQA graphs that are very stable for market areas. You can expand or contract a your boundaries for a market area, but that curve will not change much at all. Each market area has a "characteristic" curve. Here are two, one is a standard Residual vs CQA, while the other is Residual/SF vs CQA. Notice the left and right sides, which show a vary steep decline or increase in the residual price as we move toward the extremes in quality. I might find a subject that fits very well between two houses, one with a score of 0.30 and one with a score of 0.24, which map to residuals of -$50,000 and -70,000, so I give the subject a residual of -$60,000. This value minus the corresponding residuals for each comparable on the sales grid, will give my my total residual adjustment to be broken up into variabls as I see fit, subject to the constraint that the sum of all such adjustments would have to equal that difference. If the residual for Comp 1 is $10,000, then the difference would be -$70,000 - $10,000 = -$80,000. That -$80,000 might then be broken up into: Condition: -$30,000, Quality: -$30,000, Design: $30,000, Functional Utility: -20,000, Yard/Landscaping: -$30,000. -$30,000 + (-$30,000) + ($30,000) + (-$20,000) - $30,000. = -$80,000
Burlingame, CA

Pacifica, CA

You need a way to objectively MEASURE the market reaction to these variables that are innately unmeasurable by objective means.
It sounds contradictory, right?
But this is the real MAGIC of the RCA method. It is a kind of TRAP that indirectly captures market reaction to this illusive group of unmeasurable subjective variables that, thanks to mathematics, make it is as accurate as you can imagine - in fact far more accurate. This all presumes of course, that you can build a good MARS model.


