-
Welcome to AppraisersForum.com, the premier online
 community for the discussion of real estate appraisal. Register a free account to be able to post and unlock additional forums and features.
You are using an out of date browser. It may not display this or other websites correctly.
You should upgrade or use an alternative browser.
You should upgrade or use an alternative browser.
Overall Market Trend (Min 12 months)
- Thread starter Value Ninja
- Start date
- Status
- Not open for further replies.
- Joined
- May 22, 2015
- Professional Status
- Certified Residential Appraiser
- State
- Pennsylvania
If you look at pages 15, 16 on the pdf i posted on FHA/fannie thread, updates there is an explanation. They say you don't need a chart, but it appears, from their example, that you have to explain each time adjustment. I'ts a bit too much. They then say there will be a further update in the next fannie news letter. Their written example of time adjustments looks like a non linear explanation. Not sure it can be done without a program.
Joe Flacco
Elite Member
- Joined
- Jul 31, 2013
- Professional Status
- Certified Residential Appraiser
- State
- Maryland
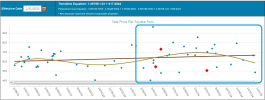
View attachment 96180
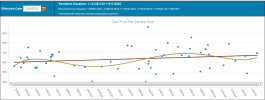
View attachment 96179
I think that datamaster polynomial curve equation is bad. I have no idea what that equation means. But that is what it is spitting out.
This is the same data populated into the MC form. It is not showing a 10% decline from June / August to today.


Look how much one extra dot changed the results. It said you need to make 10-14% downward adjustments from July / August sales for the last couple months. Now today, with the addition of one more dot, it is only 5% downward adjustment.
Stuff like this is not usable.
Joe Flacco
Elite Member
- Joined
- Jul 31, 2013
- Professional Status
- Certified Residential Appraiser
- State
- Maryland
Imagine if you were appraising that new dot and the formula said you have to adjust the 2024 sales down 14%.
OG80
Sophomore Member
- Joined
- May 3, 2021
- Professional Status
- Appraiser Trainee
- State
- Texas
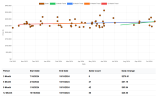
Where can I find this app? ThxJust gave Jim Amorin's app a try. He did it in html and calculates a 3 month, 6 month, 9 month, and 12 month trend. Pretty interesting - and very simple to use.
View attachment 96446
TerryRohrer
Elite Member
- Joined
- Aug 13, 2005
- Professional Status
- Certified General Appraiser
- State
- Montana
I don't know which apps are being posted above, but in a kerfuffle on Facebook, TrueFootage responded to a post that said results from TrueFootage's new time adjustment calculator were dangerous. The TrueFootage response was, put the indicated market conditions adjustment (or any others from their programs) in your adjustment grid and see if how it works. If you don't like the result, change the data or change the analysis.
That approach begs the question, if you know the answer, why are you hiding it in a program you can't explain and haven't the slightest idea what is happening within it? That is exactly the same approach as picking "comps" by price based on ? In order to do so, you have to first conclude the value of the subject, then search in relation to that conclusion. And some think only the cost approach is being "backed into."
That approach begs the question, if you know the answer, why are you hiding it in a program you can't explain and haven't the slightest idea what is happening within it? That is exactly the same approach as picking "comps" by price based on ? In order to do so, you have to first conclude the value of the subject, then search in relation to that conclusion. And some think only the cost approach is being "backed into."
Last edited:
- Joined
- Sep 14, 2004
- Professional Status
- Certified Residential Appraiser
- State
- California
Pardon my ignorance but isn't that data set indicative of an appreciating market, irrespective of seasonality?View attachment 96444
View attachment 96445
Look how much one extra dot changed the results. It said you need to make 10-14% downward adjustments from July / August sales for the last couple months. Now today, with the addition of one more dot, it is only 5% downward adjustment.
Stuff like this is not usable.
- Joined
- May 20, 2011
- Professional Status
- Certified General Appraiser
- State
- Minnesota
Don’t use this tool. It has tons of data errors and I have tried to replicate it by export the raw data into a spreadsheet and I get different results. I called my MLS who referred me to core logic. I reached out to them and they said they don’t update it and offer no support.Maybe so, but I wouldn't consider 'Texas' to be a market. When I drill down to just a zip code - no other filters applied - I get this:
View attachment 96106
- Joined
- Mar 11, 2008
- Professional Status
- Certified Residential Appraiser
- State
- Texas
It's not the tool I personally use, although I do reference that functionality from time to time. For those just dipping their toes into data analysis, though, its (IMO) not a bad place to start learning how to visualize data.Don’t use this tool. It has tons of data errors and I have tried to replicate it by export the raw data into a spreadsheet and I get different results. I called my MLS who referred me to core logic. I reached out to them and they said they don’t update it and offer no support.
- Status
- Not open for further replies.

